The Ultimate Smart Home Ecosystem Diagram: How to Map, Build, and Automate Your Connected Home
As your collection of connected devices grows from a single smart speaker to a fully integrated network of sensors, locks, cameras, and lighting, managing your setup can quickly become overwhelming. Without a clear blueprint, troubleshooting connectivity issues, planning expansions, or designing complex automations becomes a guessing game. This is where a smart home ecosystem diagram becomes an indispensable tool for both beginners and advanced enthusiasts.
A smart home ecosystem diagram is a visual representation of your entire connected home infrastructure. It maps out how devices communicate, where the central processing hubs reside, which protocols are being utilized, and how data flows from edge sensors to the cloud or local servers. By creating a comprehensive map of your network, you can eliminate bottlenecks, improve security through network segmentation, and uncover new automation opportunities that you might have otherwise missed.
In this extensive guide, we will break down the core layers of a smart home architecture, provide a step-by-step tutorial on how to draw your own ecosystem diagram, compare the top hubs and platforms, and explore how to use your map to design bulletproof automations. Whether you are running a cloud-dependent setup or a fully local Home Assistant server, understanding your ecosystem topology is the first step toward true smart home mastery.
Understanding the Core Layers of a Smart Home Ecosystem
Before you can draw a functional diagram, you must understand the architectural layers that make up a modern smart home. Unlike a traditional IT network, a smart home ecosystem relies on a diverse mix of wireless protocols, power constraints, and processing environments. We can break the ecosystem down into four distinct layers: the Edge Layer, the Network & Transport Layer, the Control Layer, and the Application Layer.
The Edge Layer (Devices and Sensors)
The edge layer consists of all the physical endpoints in your home. These are the devices that interact with the physical world, such as motion sensors, smart bulbs, thermostats, door locks, and leak detectors. When mapping this layer on your diagram, it is crucial to note the power source of each device. Battery-powered devices (like Zigbee motion sensors) rely on low-power mesh networking and sleep states to conserve energy, whereas hardwired devices (like smart switches or Wi-Fi cameras) can act as network repeaters and handle continuous data streams. Understanding the physical limitations of your edge devices will dictate how you structure your network topology.
The Network and Transport Layer (Protocols)
This layer defines how your edge devices communicate with the rest of the ecosystem. A robust smart home rarely relies on a single protocol. Instead, it utilizes a combination of technologies to balance bandwidth, range, and power consumption. Your diagram should clearly delineate the following protocol boundaries:
- Wi-Fi: Ideal for high-bandwidth devices like security cameras and smart displays, but notorious for congesting local networks and draining battery life.
- Zigbee & Z-Wave: Low-power mesh networks that require a dedicated hub. Zigbee operates on the crowded 2.4GHz band, while Z-Wave uses sub-GHz frequencies for superior wall penetration. Both are excellent for battery-operated sensors.
- Thread & Matter: The modern evolution of smart home networking. Thread provides a low-latency, IPv6-based mesh network, while Matter serves as the universal application layer that allows devices from different brands to communicate seamlessly. Learn more about the shift in our guide to Matter vs Zigbee.
- Bluetooth Low Energy (BLE): Primarily used for initial device provisioning or localized proximity triggers.
The Control Layer (Hubs, Bridges, and Servers)
The control layer is the brain of your ecosystem. It translates the various languages of the transport layer into a unified logic engine. This layer can be local (a dedicated server or hardware hub) or cloud-based (manufacturer servers). When diagramming this layer, you must identify your primary controller and any secondary bridges. For example, a Philips Hue Bridge acts as a localized controller for Zigbee lights but also bridges those lights to your main hub via your local network. Mapping these bridges is critical for understanding latency and points of failure.
The Application Layer (User Interfaces and Cloud)
The top layer is how you, the user, interact with the ecosystem. This includes smartphone applications, wall-mounted dashboards, and voice assistants. In a privacy-focused ecosystem, the application layer communicates directly with the local control layer. In a cloud-dependent ecosystem, the application layer sends commands to a remote server, which then relays them back to your home. Your diagram should highlight whether command paths stay entirely within your local area network (LAN) or if they must traverse the wider internet.
How to Draw Your Own Smart Home Ecosystem Diagram
Creating a visual map of your smart home might sound like a daunting task reserved for network engineers, but it is highly accessible with the right approach. A well-drawn diagram will save you hours of frustration when a device goes offline or when you are trying to explain your setup to a family member or a house sitter. Here is a step-by-step methodology for charting your connected home.
Step 1: Conduct a Complete Device Audit
Before drawing any lines, you need a comprehensive inventory. Open your primary smart home app and export or write down every connected device. Categorize them by room, function, and protocol. Note which devices require a proprietary hub (like Aqara or Hue) and which connect directly to your router. This audit will immediately reveal if you have too many Wi-Fi devices cluttering your router's DHCP table, signaling a need to migrate some endpoints to a Zigbee or Thread mesh.
Step 2: Map the Network Topology
Next, map out the physical and logical topology of your network. Most smart homes utilize a hybrid topology. Your Wi-Fi devices will operate on a star topology, all connecting directly to your central router or mesh nodes. Your Zigbee and Z-Wave devices will operate on a mesh topology, where hardwired devices act as routers to extend the signal to battery-powered endpoints. Draw your central router at the top of the diagram, branch out to your mesh nodes and smart hubs, and then connect the edge devices to their respective hubs. Be sure to check out our best mesh routers roundup to ensure your foundational Wi-Fi layer is up to the task.
Step 3: Identify Data Flow and Control Paths
Use different colored lines to represent data flow. For instance, use a solid green line for local, low-latency commands (like a Zigbee switch directly controlling a Zigbee bulb via the hub). Use a dashed red line for cloud-dependent commands (like asking a smart speaker to turn on a Wi-Fi plug via an external server). Visualizing these paths will quickly highlight vulnerabilities; if your internet connection drops, any automation relying on a red dashed line will fail, whereas the solid green lines will continue to function perfectly.
Step 4: Choose Your Diagramming Tools
You do not need expensive software to create a professional ecosystem diagram. Tools like Draw.io (diagrams.net), Lucidchart, or even Miro offer free, drag-and-drop interfaces with extensive network icon libraries. For those who prefer a more automated approach, software like Home Assistant features built-in topology maps for Zigbee and Z-Wave networks, which can be exported and annotated. The goal is clarity, not artistic perfection; ensure that any device's path back to the central controller is immediately obvious.
Best Devices and Hubs to Anchor Your Ecosystem
The central node of your ecosystem diagram is the most critical component you will choose. It dictates the protocols you can use, the speed of your automations, and the level of privacy you can maintain. The market is currently divided between cloud-centric ecosystems and local-first powerhouses. Let us explore the best anchors for your smart home map.
Home Assistant: The Ultimate Local Controller
For enthusiasts who demand total control, privacy, and cross-brand compatibility, Home Assistant is the undisputed king. Running on local hardware (like a Raspberry Pi, an Intel NUC, or the official Home Assistant Green), it acts as a universal translator for virtually every smart home protocol in existence. On your ecosystem diagram, Home Assistant sits at the absolute center, pulling data from local APIs, MQTT brokers, and USB dongles running Zigbee2MQTT or Z-Wave JS. Because it processes everything locally, your automations execute in milliseconds, and your data never leaves your home network.
SmartThings & Hubitat: The Hybrid Alternatives
If the command-line interface and YAML configurations of Home Assistant seem too complex, Samsung SmartThings and Hubitat offer excellent alternatives. SmartThings is heavily cloud-dependent but boasts massive native compatibility and an incredibly user-friendly app, making it ideal for beginners. Hubitat, on the other hand, is a local-first hub that offers the reliability of Home Assistant with the plug-and-play simplicity of SmartThings. When mapping a Hubitat ecosystem, you will draw a direct line from the hub to your local router, bypassing the cloud entirely for local device control. Compare the two in our detailed Home Assistant vs SmartThings breakdown.
Apple HomePod & Apple TV: The Walled Garden
For users deeply entrenched in the Apple ecosystem, the Apple TV 4K and HomePod mini serve as the central hubs. Apple's architecture relies heavily on Thread and Matter, utilizing its hubs as Thread Border Routers. In an Apple HomeKit diagram, the iCloud servers act as the remote access gateway, while the local hubs manage the day-to-day mesh networking. It is a highly secure, albeit closed, ecosystem that prioritizes privacy and seamless integration with iOS devices over raw, granular customization.
The Importance of Multi-Protocol Dongles
Regardless of the hub you choose, your diagram will likely require external USB coordinators or bridges to speak to different languages. A hub with a built-in Zigbee radio might still need a separate Thread border router or a Z-Wave Long Range dongle to accommodate all your devices. Mapping these physical connections (e.g., a Sonoff Zigbee 3.0 USB Dongle Plus connected via an extension cable to avoid USB 3.0 interference) is a pro-tip that will save you from inexplicable network dropouts.
Designing Automations Based on Your Diagram
Once your smart home ecosystem diagram is complete, it transforms from a static map into a dynamic planning tool for automations. By looking at the physical and logical connections between devices, you can design routines that are both highly responsive and resilient to network failures.
State-Based vs. Event-Based Logic
Your diagram helps you distinguish between state-based and event-based triggers. An event is a momentary action (like a button being pressed), while a state is a continuous condition (like a room being occupied). If your diagram shows a motion sensor connected via Zigbee to a local hub, and a smart bulb connected via Wi-Fi to the cloud, a state-based automation (turning off the light after 5 minutes of no motion) might suffer from latency or cloud timeouts. However, if both devices are mapped to the same local Zigbee mesh, the automation will be instantaneous. Always strive to keep trigger devices and action devices on the same local protocol branch whenever possible.
Visual Programming with Node-RED
For advanced users, the ecosystem diagram naturally evolves into a visual programming environment like Node-RED. Node-RED allows you to literally draw your automations using a flow-based interface. You drag an 'inject' node (the trigger), connect it to a 'function' node (the logic or condition), and wire it to an 'output' node (the action). This visual representation mirrors your physical ecosystem diagram, making it incredibly easy to debug complex, multi-condition routines like a 'Goodnight' sequence that checks door locks, adjusts the thermostat, and arms the security system only if all family members' phones are detected on the local Wi-Fi.
Mapping Fallback Scenarios
A well-designed automation accounts for failure. Use your diagram to identify single points of failure. If your primary internet connection drops, how will your smart blinds know to close at sunset? By mapping a local astronomical clock node within your hub, you ensure the automation survives an internet outage. Documenting these fallback paths on your diagram ensures your home remains 'smart' even when the outside world is disconnected.
Privacy, Security, and Network Segregation
The Internet of Things (IoT) is notorious for security vulnerabilities. Many cheap smart devices lack basic encryption, receive infrequent firmware updates, and constantly phone home to foreign servers. Your smart home ecosystem diagram is your primary defense mechanism, allowing you to visualize and implement network segregation.
Implementing VLANs for IoT Devices
Virtual Local Area Networks (VLANs) allow you to slice your single physical router into multiple, isolated logical networks. On your diagram, you should draw a hard boundary between your 'Trusted' network (where your phones, laptops, and local servers reside) and your 'IoT' network (where smart bulbs, cheap Wi-Fi plugs, and cloud cameras live). By setting up firewall rules that prevent the IoT VLAN from initiating connections to the Trusted VLAN, you ensure that a compromised smart toaster cannot be used as a backdoor to access your personal computer. Read our comprehensive guide on smart home network security to learn how to configure these rules.
DNS Sinkholes and Local Control
Another critical addition to your diagram is a DNS sinkhole, such as Pi-hole or AdGuard Home. By routing all IoT traffic through a local DNS server, you can block devices from communicating with their manufacturer's telemetry servers. On your ecosystem map, the DNS server sits between the IoT VLAN and the internet gateway. If a device requires cloud access to function (like a smart plug), you allowlist its specific domain. If it does not, you block it entirely, forcing the device to operate strictly on your local network and drastically improving your privacy.
The Privacy Implications of Voice Assistants
When mapping voice assistants like Amazon Echo or Google Nest, you must draw a direct, unencrypted line from the device to the manufacturer's cloud servers. These devices are essentially always-on microphones that stream audio to remote data centers for processing. If privacy is a core tenet of your smart home, your diagram should highlight these devices as external dependencies, and you might consider replacing them with local voice processing solutions like Rhasspy or Willow, which keep all audio data strictly within your local LAN.
Ecosystem Comparison: Mapping the Big Three
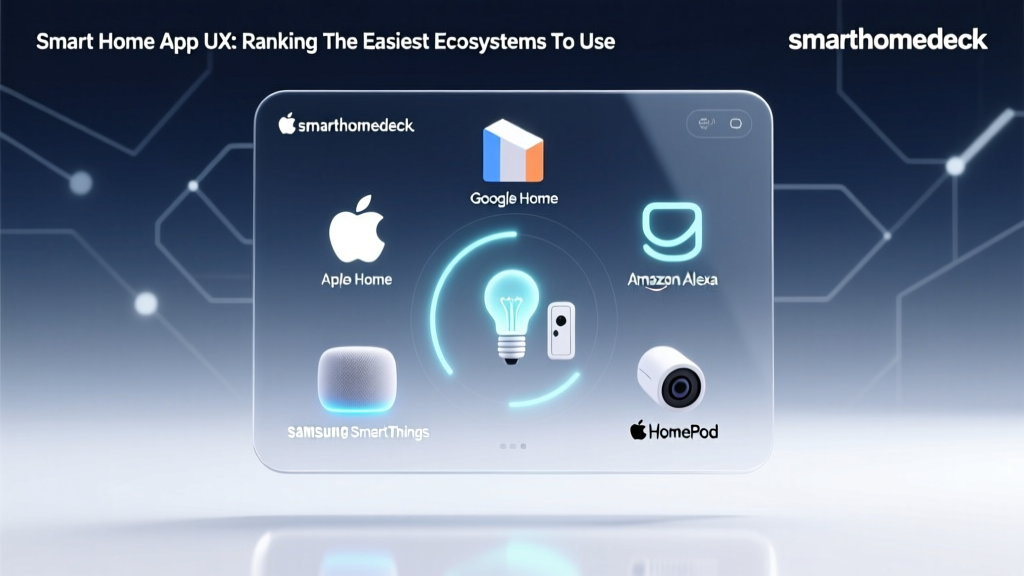
While local hubs offer the most flexibility, millions of users rely on the 'Big Three' commercial ecosystems: Apple HomeKit, Google Home, and Amazon Alexa. Each of these platforms has a distinctly different architecture, which drastically changes how their ecosystem diagrams look and function.
Apple HomeKit: The Local-First Walled Garden
Apple's ecosystem diagram is heavily skewed toward local processing and strict security. Devices must undergo rigorous hardware certification to earn the 'Works with Apple Home' badge. The Apple TV or HomePod acts as a local hub and a Thread Border Router. Commands sent from your iPhone to a smart light via HomeKit are processed locally whenever you are on the same Wi-Fi network. Only when you leave the house does the command route through Apple's iCloud servers, which act merely as an encrypted relay rather than a processing engine. Explore the full depth of this platform in our Apple HomeKit ecosystem guide.
Google Home: The Cloud-Centric Intelligence
Google's architecture is fundamentally different. While Google has introduced local processing via Nest Hubs and Matter support, the vast majority of Google Home automations and voice commands rely on Google's massive cloud infrastructure. On a Google ecosystem diagram, the data flow often travels from the device, to your router, out to the internet, into Google's servers for logic processing, and back down to the target device. This allows for incredibly advanced AI-driven routines and natural language processing, but it introduces latency and a heavy reliance on a stable internet connection. Dive deeper into the Google Home ecosystem to see if it fits your needs.
Amazon Alexa: The Fragmented Giant
Amazon's ecosystem is the most fragmented but also the most ubiquitous. Echo devices feature built-in Zigbee hubs, Matter controllers, and even Amazon Sidewalk (a low-bandwidth, neighborhood-wide mesh network). An Alexa diagram is often a complex web of proprietary skills, cloud-based routines, and local Zigbee meshes. While Alexa excels at broad compatibility and third-party integrations, its reliance on cloud-based 'Skills' means that a server outage at a third-party manufacturer can break your automations. Learn more about managing this complexity in our Amazon Alexa ecosystem review.
Frequently Asked Questions (FAQ)
Do I need a hub if I use Wi-Fi smart devices?
Technically, no. Wi-Fi smart devices connect directly to your home router and communicate with the cloud without a dedicated hub. However, from an ecosystem design perspective, relying solely on Wi-Fi devices is highly discouraged. Most consumer routers are designed to handle a dozen or so high-bandwidth devices like laptops and phones, not fifty low-bandwidth smart bulbs and plugs. Overloading your Wi-Fi network with IoT devices will lead to dropped connections, slow internet speeds, and failed automations. Utilizing a hub with a dedicated Zigbee, Z-Wave, or Thread radio offloads these devices from your main Wi-Fi network, creating a much more stable and scalable ecosystem.
How does Matter change my smart home ecosystem diagram?
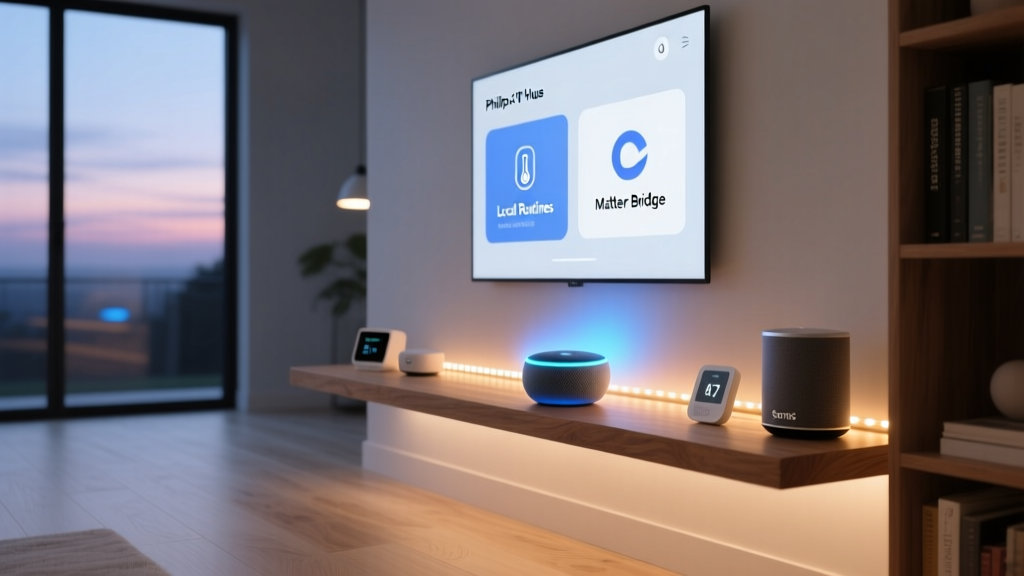
Matter fundamentally simplifies the control layer of your diagram. Before Matter, integrating an Aqara sensor with a Philips Hue bulb required a complex web of third-party cloud integrations or local API workarounds. Matter acts as a universal language at the application layer. On your diagram, Matter eliminates the need for proprietary cloud bridges. As long as your central hub (whether it is an Apple TV, a SmartThings Station, or a Home Assistant server) supports Matter over Thread or Wi-Fi, it can communicate directly with any Matter-certified device locally. This drastically reduces latency, improves privacy, and cleans up the visual clutter of your ecosystem map.
What is the best software to draw a smart home network map?
For most users, Draw.io (now diagrams.net) is the best free tool available. It runs directly in your browser, requires no account, and includes extensive Cisco and AWS network icon packs that are perfect for representing routers, servers, and IoT endpoints. If you prefer a more collaborative or visually polished interface, Lucidchart and Miro are excellent premium alternatives. For users who want their diagram to update automatically, network monitoring tools like Ubiquiti's UniFi Controller or software like Fing can generate real-time topology maps of your local network, though they lack the ability to map wireless protocols like Zigbee or Z-Wave mesh routes.
How often should I update my smart home diagram?
You should treat your smart home ecosystem diagram as a living document. At a minimum, it should be updated whenever you add a new hub, change your network topology (such as upgrading to a new mesh router or implementing VLANs), or migrate devices from one protocol to another. Many smart home enthusiasts keep a digital version of their diagram in a note-taking app like Notion or Obsidian, updating it in real-time as they purchase and deploy new gear. Having an accurate, up-to-date map is invaluable when troubleshooting sudden network issues or when planning your next big home automation project.
Conclusion
Building a smart home without an ecosystem diagram is like building a house without a blueprint. You might get a few walls up, but eventually, the structure will become unstable, and making changes will be incredibly difficult. By taking the time to map out your edge devices, network protocols, central hubs, and data flows, you transition from a mere consumer of smart gadgets to a true architect of your living space.
Whether you are leveraging the local power of Home Assistant, the seamless integration of Apple HomeKit, or the broad compatibility of SmartThings, a visual map empowers you to make informed decisions about security, privacy, and automation logic. Start your audit today, draw your first topology, and watch as your connected home transforms from a chaotic web of gadgets into a symphony of seamless, intelligent automation.