The Evolution of the Smart Energy Dashboard
The modern smart home is no longer just about turning on lights with your voice or adjusting the thermostat from your phone. The frontier of home automation has shifted toward comprehensive resource management, specifically through the smart home energy dashboard. As utility rates fluctuate and grid instability becomes a growing concern, homeowners are turning to centralized control panels to visualize, manage, and optimize their electrical consumption. According to research highlighted by the National Renewable Energy Laboratory (NREL), integrating smart home energy management systems (HEMS) with grid-interactive technologies can significantly reduce peak demand and lower household carbon footprints.
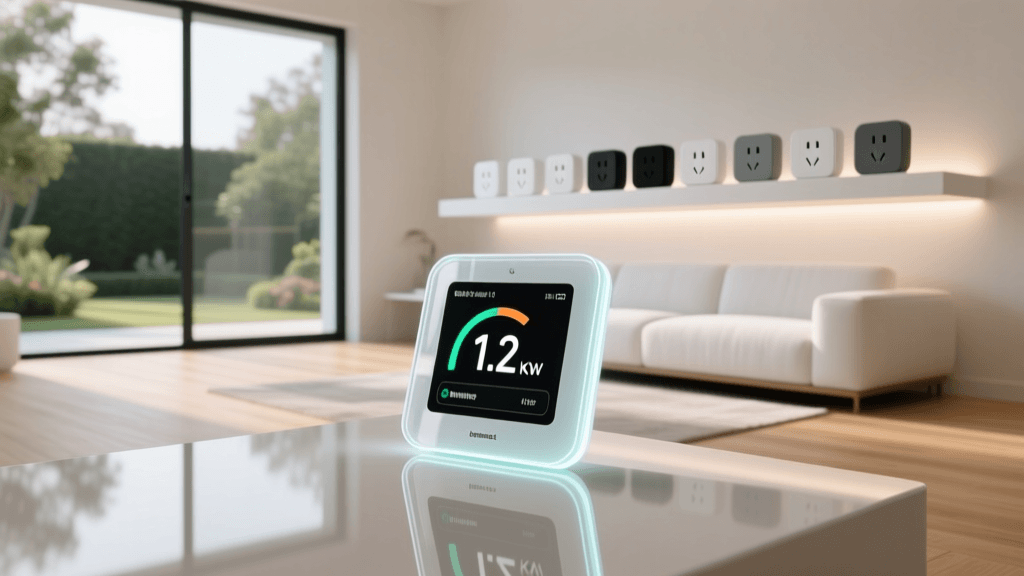
An energy dashboard serves as the command center for your home's electrical ecosystem. Unlike traditional utility meters that only provide a monthly total, a smart energy control panel breaks down consumption in real-time, often sampling data at one-second intervals. This granular visibility allows you to identify "vampire loads" (devices that draw power even when turned off), monitor the output of your solar array, and automate heavy appliances to run only when electricity rates are at their lowest. Whether you are using a dedicated hardware hub, a smart electrical panel, or a software-based aggregator like Home Assistant, mastering your energy dashboard is the most impactful step you can take toward a sustainable and cost-efficient smart home.
Core Hardware: Choosing the Right Energy Monitor
Before you can build a beautiful, data-rich dashboard, you need accurate telemetry. The foundation of any energy control panel is the hardware monitor, which typically uses Current Transformer (CT) clamps attached to the main electrical lines in your breaker box. These clamps measure the magnetic field generated by the electrical current, translating it into readable wattage data without requiring direct galvanic contact with live wires.
When selecting hardware for your energy dashboard, you must consider your home's electrical service (e.g., 100A vs. 200A), your budget, and whether you prefer local processing over cloud-dependent apps. Below is a comparison of the top energy monitoring solutions available today:
| Device / System | Monitoring Type | Est. Cost Range | Best For |
|---|---|---|---|
| Emporia Vue 2 / Vue 3 | Main + 16 Individual Circuits | $150 - $200 | DIY enthusiasts & Home Assistant users |
| Sense Energy Monitor | Main + AI Device Disaggregation | $250 - $300 | Users wanting an easy, all-in-one cloud app |
| Span.io Smart Panel | Circuit-Level Control & Monitoring | $1,000 - $1,500+ | Solar/Battery owners needing outage management |
| Shelly EM / Pro EM | 1 to 2 Circuits (DIN Rail) | $60 - $120 | Monitoring specific heavy loads (EVs, HVAC) |
For most users building a custom dashboard, the Emporia Vue series offers the best return on investment. It provides main-line monitoring plus up to 16 individual circuit branches, allowing you to see exactly how much power your electric oven, HVAC blower, or EV charger is drawing. For those building a new home or undertaking a major renovation, the Span.io Smart Panel replaces the traditional breaker box entirely, offering circuit-level control and seamless integration with battery backup systems.
Designing Your Centralized Energy Control Panel
Once the hardware is installed, the next step is designing the user interface. While proprietary apps (like the Sense app or Brilliant Control wall panels) offer polished, out-of-the-box experiences, advanced users typically gravitate toward Home Assistant or Grafana for ultimate customization. The Home Assistant Energy Dashboard is a powerful, built-in feature that aggregates data from your monitors, solar inverters, and smart plugs into a unified, visually appealing control panel.
A well-designed energy dashboard should answer three critical questions at a glance:
- Current State: What is my home consuming right now, and what is the grid/solar providing?
- Historical Trends: How does today's usage compare to the same day last week or last month?
- Financial Impact: How much money have I spent today based on my specific utility rate plan?
To understand where to focus your optimization efforts, it helps to look at macro-level energy consumption trends. The chart below illustrates how the average household's energy footprint is distributed across major appliance categories.
Average U.S. Home Energy Consumption by Category
As visualized above, Heating, Ventilation, and Air Conditioning (HVAC) dominates home energy use, accounting for nearly half of all consumption. Therefore, your smart home control panel should prioritize HVAC telemetry. Integrating smart thermostats (like the Ecobee SmartThermostat Premium or Google Nest Learning Thermostat) directly into your energy dashboard allows you to correlate outdoor temperature spikes with indoor kilowatt-hour (kWh) draw, helping you fine-tune your insulation and temperature setbacks.
Actionable Automations for Peak Energy Savings
A dashboard is only as good as the actions it inspires or automates. The true power of a smart home energy control panel lies in its ability to trigger automations based on real-time grid conditions, specifically Time-of-Use (TOU) rate plans. Under TOU plans, utilities charge significantly more per kWh during peak evening hours (e.g., 4:00 PM to 9:00 PM) when grid demand is highest.
By feeding your utility's TOU schedule into your smart home hub, you can create highly effective energy-saving automations. Here are two practical examples you can implement via your dashboard:
1. The Peak-Hour Load Shedding Automation
Trigger: Current time enters Peak TOU window AND Grid Price > $0.15/kWh.
Condition: Home battery (if applicable) is below 30% capacity.
Actions:
- Adjust smart thermostat setpoint by +2°F (cooling) or -2°F (heating).
- Pause Level 2 EV charging via Wi-Fi enabled charger (e.g., ChargePoint Home Flex or Emporia Level 2).
- Send a push notification to the primary dashboard tablet: "Peak rates active. Heavy loads deferred."
2. The Solar Surplus Appliance Trigger
Trigger: Solar inverter production exceeds home base load by > 2,000 Watts for 15 consecutive minutes.
Condition: Dishwasher or Washing Machine is in "standby" (detected via smart plug drawing < 5W).
Actions:
- Send an alert to the kitchen control panel: "Free solar energy available! Start dishwasher now to save $0.45."
- Activate smart water heater relay to pre-heat the tank using excess solar, effectively turning the water heater into a thermal battery.
Integrating Solar, EV Chargers, and Battery Storage
For homes equipped with renewable generation, the energy dashboard transitions from a simple monitoring tool into a complex microgrid management system. The U.S. Department of Energy's Energy Saver portal emphasizes that homes with solar and battery storage require active management to maximize self-consumption and minimize grid reliance. If you export power to the grid in a region with poor net-metering policies, you are essentially giving away your electricity for pennies.
To prevent this, your control panel must integrate directly with your solar inverter (e.g., Enphase IQ, SolarEdge) and battery system (e.g., Tesla Powerwall, FranklinWH). By utilizing local APIs or integrations like the Tesla Powerwall local gateway, your dashboard can prioritize self-consumption. For example, if your dashboard detects that your battery is at 100% and solar production is peaking, it can automatically trigger your smart EV charger to begin charging your vehicle, ensuring that the clean energy you generated is stored in your car's battery rather than being exported to the grid at a financial loss.
Privacy, Security, and Local vs. Cloud Processing
When building an energy control panel, data privacy is a frequently overlooked consideration. Cloud-dependent monitors like Sense require a constant internet connection to process the high-frequency waveform data needed for device disaggregation. If your internet goes down, your dashboard goes blind. Furthermore, detailed energy usage data can reveal intimate details about your daily routines—when you wake up, when you leave for work, and when you are on vacation.
For security and reliability, prioritizing local processing is highly recommended. Hardware like the Emporia Vue (when flashed with custom firmware or used via local MQTT brokers), Shelly EM, and the Home Assistant ecosystem operate entirely on your local network. This ensures that your energy dashboard remains fully functional during internet outages, which is especially critical during severe weather events when grid instability is most likely to occur. Local dashboards also eliminate the latency associated with cloud polling, giving you instantaneous feedback when you toggle a heavy appliance.
Calculating Your ROI and Next Steps
Investing in a smart home energy dashboard and the accompanying hardware is a financial decision that typically pays for itself within 12 to 24 months. A basic setup using a Shelly EM and a few smart plugs can be assembled for under $150, providing enough data to identify and eliminate $10-$15 per month in vampire loads. A more robust, whole-home solution like the Emporia Vue paired with a dedicated Home Assistant server (such as the Home Assistant Green) will cost around $250-$350 but can unlock hundreds of dollars in annual savings through TOU automation and solar optimization.
To begin your journey, start by auditing your electrical panel and identifying your heaviest loads. Purchase a circuit-level monitor that supports local API access, mount it safely (always hire a licensed electrician for panel-level installations), and begin aggregating your data. Once your baseline is established, use your new smart home control panel to experiment with automations, turning your house into an intelligent, energy-efficient machine that works in harmony with both your wallet and the power grid.