The Power of Visibility: Why You Need an Energy Dashboard
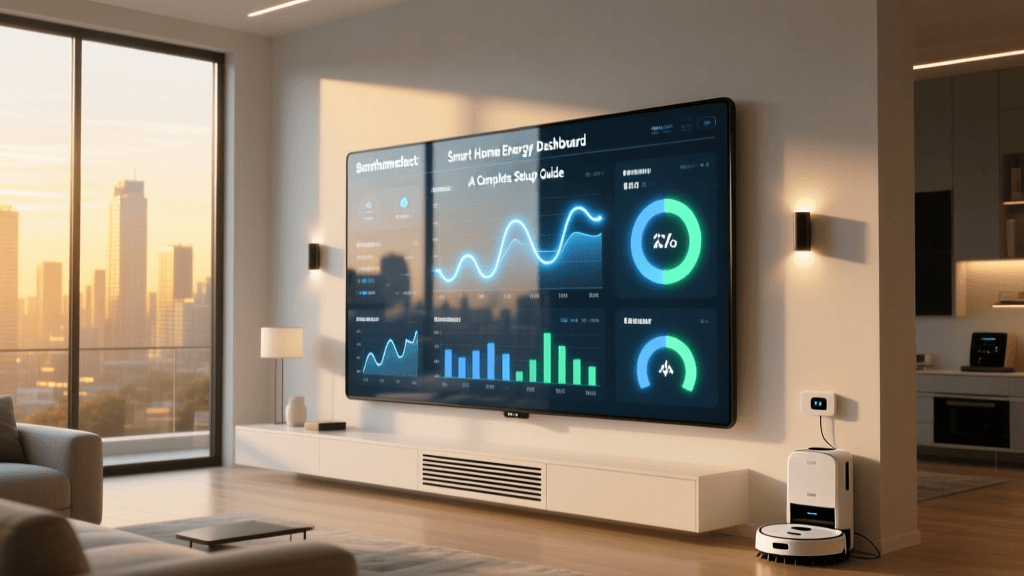
In the modern connected home, energy consumption is often an invisible expense. Most homeowners only think about their electricity usage when the monthly utility bill arrives—a lagging indicator that offers no actionable insights into daily habits or malfunctioning appliances. A smart home energy dashboard transforms this opaque data into a real-time, interactive control panel, empowering you to monitor, analyze, and optimize your home's power consumption.
According to the U.S. Energy Information Administration, the average American household consumes nearly 11,000 kilowatt-hours (kWh) of electricity annually. Without granular visibility, identifying which specific circuits or devices are driving those costs is nearly impossible. By centralizing data from smart plugs, whole-home monitors, and intelligent thermostats into a single dashboard, you shift from passive billing to active energy management.
A well-configured energy dashboard does not just show you what you spent yesterday; it helps you predict what you will spend tomorrow and automates decisions to lower that cost.
This guide will walk you through the essential hardware, software ecosystems, and configuration strategies required to build a comprehensive smart home energy control panel, ultimately helping you reduce your carbon footprint and lower your monthly utility bills.
Choosing the Right Control Panel Ecosystem
The foundation of any energy dashboard is the software platform that aggregates and visualizes the data. While many smart devices come with their own native apps, a unified control panel is necessary for holistic home management. Here are the top ecosystems for energy monitoring:
1. Home Assistant (The Enthusiast's Choice)
Home Assistant features a dedicated, built-in Energy Dashboard that is widely considered the gold standard for local, privacy-focused smart home control. It supports grid consumption, solar return-to-grid, battery storage, gas, and water monitoring. Because it is open-source and protocol-agnostic (supporting Zigbee, Z-Wave, Matter, and Wi-Fi), you can integrate virtually any energy-monitoring device on the market. The trade-off is a steeper learning curve and the need for dedicated hardware, like a Raspberry Pi or a Home Assistant Green hub.
2. Samsung SmartThings (The Consumer-Friendly Hub)
SmartThings offers a feature called SmartThings Energy, which provides a clean, user-friendly interface for tracking power usage. It excels at integrating with Samsung appliances, smart plugs, and HVAC systems. While it lacks the granular, circuit-level customization of Home Assistant, it is highly accessible for users who want a plug-and-play experience with robust mobile and smart TV dashboard widgets.
3. Schneider Electric Wiser (The Whole-Home Professional)
For homes undergoing major renovations or electrical upgrades, Schneider Electric's Wiser system offers a premium, integrated approach. The Wiser Energy app pairs with smart breakers and dedicated energy monitors to provide circuit-level insights without the need for aftermarket smart plugs. It is highly reliable but requires professional installation and a significant upfront investment.
Platform Comparison Matrix
| Platform | Best For | Hardware Cost | Real-Time Granularity | Ease of Setup |
|---|---|---|---|---|
| Home Assistant | Advanced users, solar owners | $100 - $150 (Hub) | Extremely High (Device/Circuit) | Difficult |
| Samsung SmartThings | General consumers, Samsung appliance owners | $80 - $130 (Hub) | Medium (Device level) | Easy |
| Schneider Wiser | New builds, major electrical retrofits | $400+ (Breakers/Monitor) | High (Circuit level) | Moderate (Pro Install) |
Essential Hardware: Feeding Your Dashboard Accurate Data
Your dashboard is only as good as the data feeding it. To build a comprehensive energy control panel, you need a layered approach to hardware monitoring, capturing both macro (whole-home) and micro (individual appliance) metrics.
Whole-Home Energy Monitors
These devices install directly into your main electrical breaker panel using Current Transformer (CT) clamps. They measure the total magnetic field around your main power lines to calculate real-time wattage and cumulative kWh.
- Emporia Vue 2: A standout choice for dashboard enthusiasts. It features a main CT clamp for total home usage and up to sixteen individual 50A CT clamps to monitor specific circuits (e.g., HVAC, electric oven, EV charger). It integrates seamlessly with Home Assistant via local MQTT or cloud APIs.
- Sense Energy Monitor: Sense uses machine learning to attempt to identify individual appliances based on their unique electrical signatures. While its device detection can sometimes be inconsistent, its main panel accuracy and native dashboard app are highly polished.
Smart Plugs with Energy Monitoring
For plug-in devices, smart plugs equipped with internal shunt resistors measure the exact power draw of the connected appliance. They are crucial for identifying 'vampire loads'—devices that draw power even when turned off.
- Shelly Plug US: Compact, highly accurate, and natively supports local MQTT and REST APIs, making it a favorite for custom dashboard builders. It provides real-time wattage, voltage, and historical kWh data.
- TP-Link Kasa EP25: A reliable, budget-friendly option with robust app support and growing Matter compatibility, ideal for users in the SmartThings or Apple HomeKit ecosystems.
Smart Thermostats and HVAC Tracking
Heating and cooling represent the largest slice of residential energy use. The EPA's Energy Star program notes that certified smart thermostats can save households an average of 8% on heating and cooling bills. Devices like the Ecobee SmartThermostat Premium or the Google Nest Learning Thermostat do more than adjust temperatures; they track HVAC runtime hours and estimated energy consumption, feeding this vital data directly to your central dashboard.
Step-by-Step: Configuring Your Energy Dashboard
Once your hardware is installed and connected to your network, it is time to configure the dashboard logic. Follow these steps to ensure your control panel provides actionable insights.
Step 1: Establish the Baseline and Grid Import/Export
If you have solar panels, your dashboard must understand the difference between power you generate, power you consume, and power you pull from (or push to) the grid. Configure your main CT clamps to read 'Grid Consumption' and 'Return to Grid.' In platforms like Home Assistant, you must assign the correct utility tariff rates to these entities so the dashboard can calculate actual financial costs, not just raw kilowatt-hours.
Step 2: Map the Vampire Loads
The U.S. Department of Energy estimates that standby power accounts for 5% to 10% of residential energy use. Use your smart plug data to group devices into a 'Phantom Load' dashboard widget. Look for home entertainment centers, desktop computers, and older microwaves that draw 5W to 15W continuously. Seeing these micro-loads aggregated into a monthly cost on your dashboard is often the catalyst for behavioral change.
Step 3: Integrate Time-of-Use (TOU) Rates
Many utility companies now charge variable rates based on the time of day. Peak hours (usually late afternoon to early evening) carry a premium, while off-peak hours (overnight) are heavily discounted. Advanced dashboards allow you to input your utility's TOU schedule. This enables your control panel to display your 'Cost Optimization Score,' showing you what percentage of your heavy energy use (like EV charging or laundry) occurred during off-peak windows.
Visualizing the Data: Where Does Your Power Go?
Understanding the macro-level breakdown of household energy consumption helps you prioritize which areas of your dashboard require the most attention. While every home is unique based on climate, insulation, and appliance efficiency, national averages provide a reliable benchmark for setting up your dashboard's primary monitoring categories.
As illustrated in the chart above, HVAC and Water Heating dominate the energy landscape. Therefore, your dashboard's primary real estate should be dedicated to climate control metrics and thermal storage monitoring. If your dashboard shows your 'Appliances' or 'Electronics' categories rivaling your HVAC usage, it is a strong indicator of severe inefficiencies or massive vampire loads requiring immediate intervention.
Key Metrics to Monitor Daily and Monthly
A cluttered dashboard leads to alert fatigue. To maintain an effective control panel, curate your widgets to display only the most critical metrics.
Real-Time Wattage (W) vs. Cumulative Energy (kWh)
Watts measure the current rate of energy flow, while kilowatt-hours measure the total volume of energy consumed over time. Your dashboard's main header should display real-time Wattage. This allows you to walk through your house, turn off a switch, and instantly see the wattage drop on your phone, providing immediate positive reinforcement. Historical graphs, however, must use kWh to calculate financial costs accurately.
Peak Demand Tracking
Some utility providers charge 'demand fees' based on the single highest 15-minute spike in power usage during a billing cycle. A sophisticated dashboard will track your current 15-minute rolling average and trigger an alert if you are about to exceed your target peak, allowing you to manually pause high-draw devices like the EV charger or electric oven.
Solar Self-Consumption Ratio
For solar owners, the goal is to consume the power you generate rather than selling it back to the grid at a low wholesale rate. Your dashboard should feature a gauge showing your daily 'Self-Consumption Percentage.' A high percentage means your automations are successfully aligning heavy loads with peak solar production hours.
Advanced Dashboard Automations for Energy Savings
The true power of a smart home energy dashboard is realized when you transition from passive monitoring to active automation. By using your energy data as triggers, you can program your control panel to make financial decisions on your behalf.
Load Shifting and Solar Surplus Routing
If your whole-home monitor detects that your solar panels are producing a surplus of energy that is being exported to the grid, your dashboard can trigger an automation to turn on the smart plug connected to your water heater, start the dishwasher, or increase the EV charging amperage. This 'Solar Surplus Routing' ensures you are using your free, self-generated electrons rather than buying them back later at night.
Grid-Aware HVAC Setbacks
Integrate your dashboard with grid health APIs or TOU pricing schedules. During peak pricing windows (e.g., 4:00 PM to 9:00 PM), your dashboard can automatically adjust your smart thermostat by two degrees and dim non-essential smart lighting. Once the off-peak window opens, the system reverts to your preferred comfort settings. Over a year, these micro-adjustments, orchestrated entirely by your dashboard, can result in hundreds of dollars in savings.
Automated Phantom Load Elimination
Group your home office equipment and entertainment center onto smart power strips or relay-controlled circuits. Create an automation that monitors the real-time wattage of these circuits. If the dashboard detects that the main device (like a PC or TV) has dropped below 20W—indicating it has been turned off—the automation triggers the smart plug to cut power entirely to peripheral devices (monitors, game consoles, soundbars), eliminating their standby draw until the main device is turned back on.
Conclusion: Taking Control of Your Energy Footprint
Building a smart home energy dashboard is one of the most financially rewarding projects you can undertake in the connected home space. By moving beyond fragmented app ecosystems and centralizing your data into a unified control panel, you gain unprecedented visibility into your home's metabolic rate. Whether you choose the deep customization of Home Assistant, the consumer-friendly interface of SmartThings, or the professional grade of Schneider Wiser, the key to success lies in accurate hardware measurement and intelligent automation. Start by monitoring your whole-home baseline, identify your biggest energy hogs, and let your dashboard do the heavy lifting of optimizing your home's power consumption for years to come.